Introduction
The main site is at tomviz.org. This site serves as a home for online documentation of the desktop application, and related documentation. For the latest release please check out the downloads page. The project is developed primarily in C++, with a data pipeline that offers Python or C++ transforms. The GUI is Qt-based, and the code is distributed under the 3-clause BSD license.
About
The Tomviz project was founded by Marcus D. Hanwell and Utkarsh Ayachit at Kitware, David A. Muller at Cornell University, and Robert Hovden at the University of Michigan under DOE Office of Science contract DE-SC0011385. If you find it useful in your research we would appreciate you citing tomviz.org. It is developed by a large group of developers, collaborators and users in the community, and contributions are welcome through the main Github project page. This page offers a complete list of contributors, older releases, issue tracking, and more.
What’s New in 3.0
Tomviz 3.0 includes a major overhaul of the application’s pipeline architecture and user interface:
New pipeline model - The pipeline has been redesigned around a node-based graph of sources, transforms, and visualizations connected by typed ports and links. A new vertical strip widget provides an interactive visual representation of the pipeline.
Terminology updates - “Modules” are now called “Visualizations” and “Workflows” are now called “Sources” throughout the application.
Reorganized menus - The Data Transforms, Segmentation, and Tomography menus are now organized into logical subcategories, with a search dialog accessible from each menu.
New reconstruction methods - SIRT, ART, and TV reconstruction algorithms have been added, along with GPU acceleration for SIRT and MLEM via TomoPy.
New data formats - Enhanced DICOM, HyperSpy,
.npy, and.matfile reading, plus DICOM and MRC writing support.Drag-and-drop - Data files and state files can be loaded by dragging them onto the application window.
Cylindrical crop - A new interactive 3D cylindrical cropping tool.
Data generators - Built-in sources for generating constant datasets, random particles, and electron beam shapes.
Pipeline controls - Pause, stop, and resume pipeline execution, with live progress reporting.
Per-node Python environments - Individual transforms can execute in separate conda environments.
Getting Started
The Tomviz application supports all phases of your tomography workflow:
Preprocessing
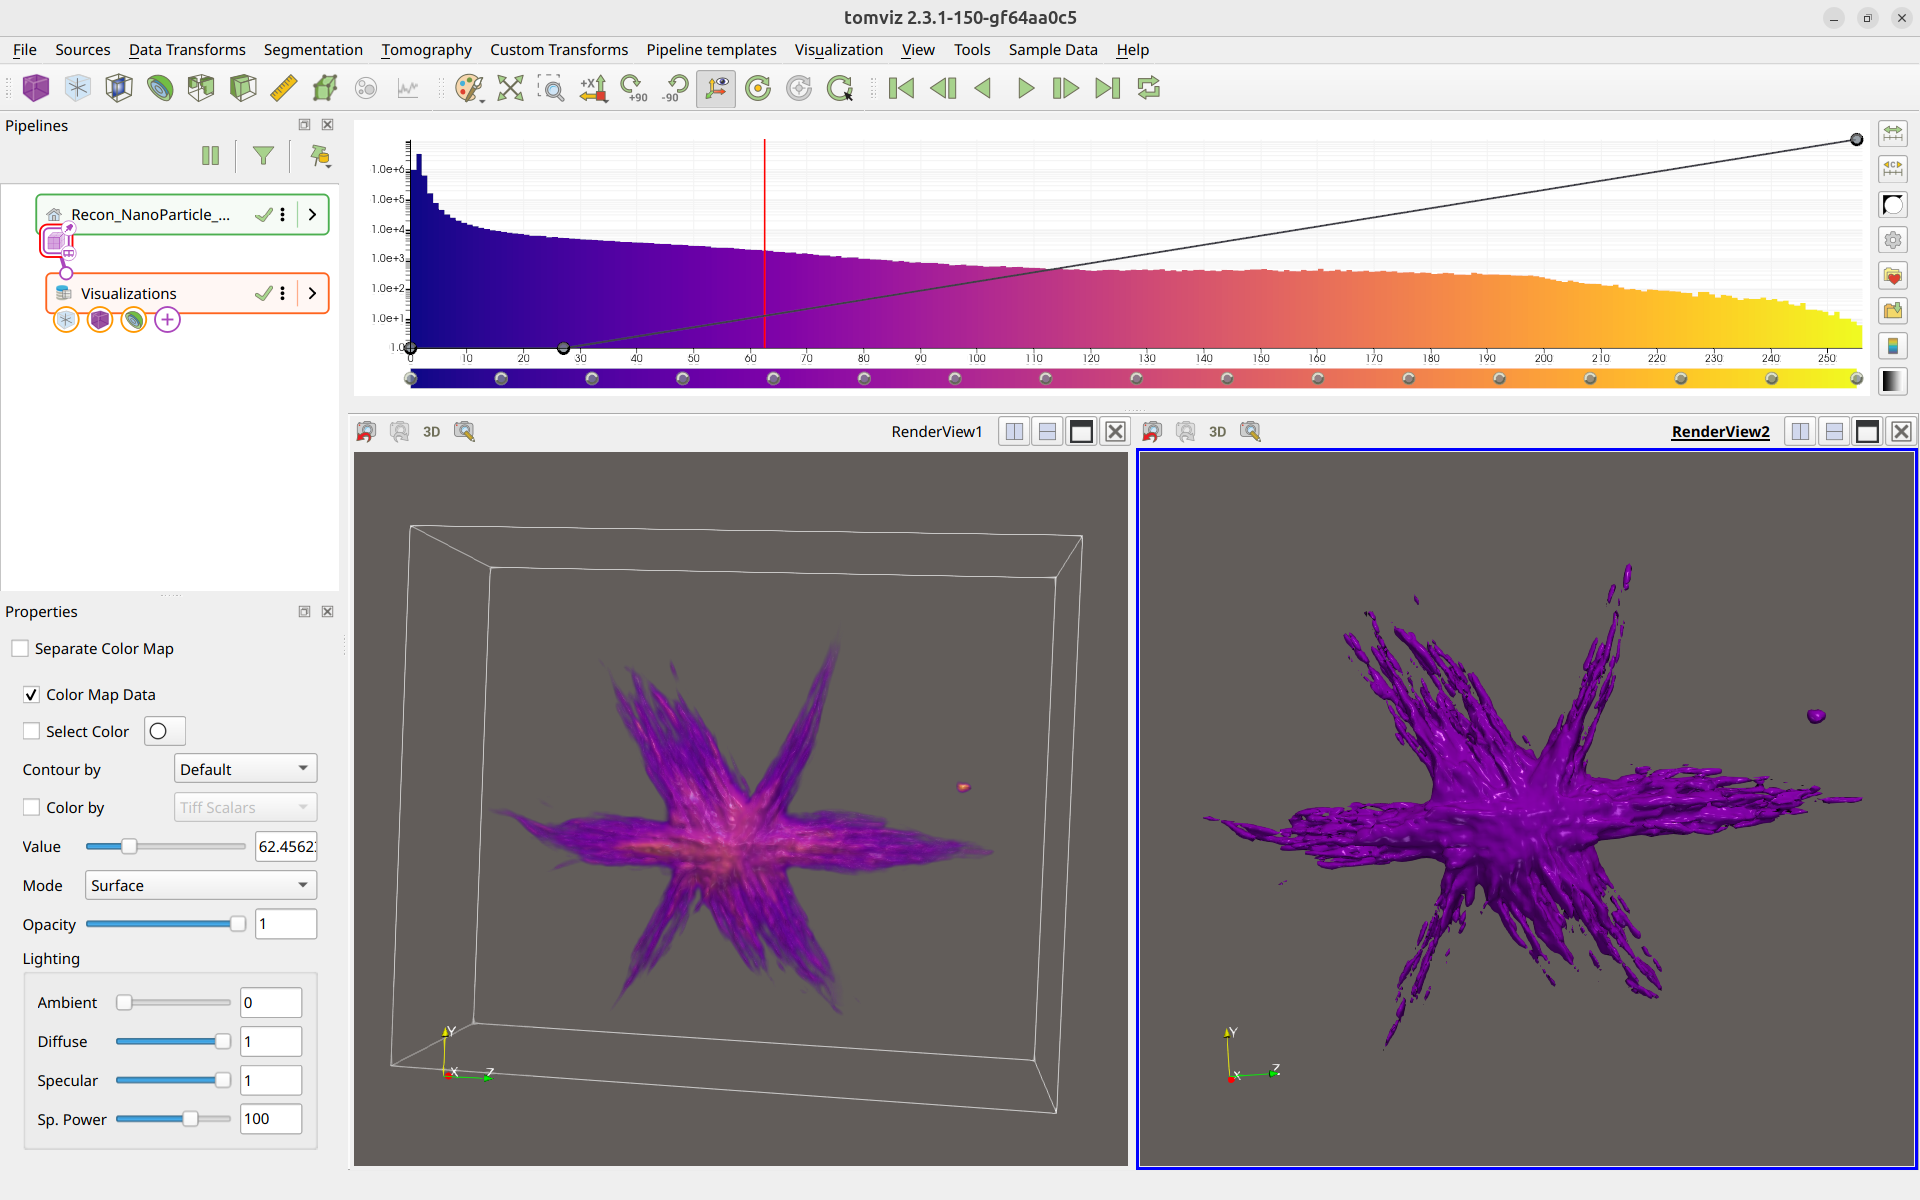
The application is shown below with some data loaded and a couple of different representations of the data (volume render and isosurface). The integrated histogram-color-opacity editor is at the top-right, and the pipeline strip widget is at the top-left.
You can download the latest release (first block) or the latest builds (second
block) if you want to check out the latest improvements at the risk of less
stability. For Windows the installer is the simplest method, but the zip file
can be unpacked anywhere and run without administrator privileges. The macOS
DMG is relocatable and can be installed wherever you like. For Windows and
Linux, the Tomviz executable is in the bin directory.
Tutorials and Documentation
In addition to this new documentation resource there are several other tutorials:
If you know of other available material that should be featured please let us know.
First Steps
Once you open the application you will be offered the opportunity to open an
example data set, this will display a volume rendering of a reconstructed
nanoparticle. The Sample Data menu offers the reconstruction
and tilt series for the star nanoparticle, along with options for generating
simulated data or downloading open data sets for TEM tomography data.