Analysis
The analysis pipeline consists principally of data operators,
these are pipeline objects that can perform various analytical functions on the
volumetric data. The first place to look would be the Data Transforms menu,
along with the Segmentation menu. Tomviz comes bundled with a full Python 3.7
environment, including NumPy, SciPy, Python-wrapped ITK, etc.
Data Transforms
Data transforms contain a number of useful operators to analyze your data. They
are implemented in C++ or Python, and are grouped in the Data Transforms
top-level menu. Some are very simple, and operate immediately on the data while
others require some parameters to be set.
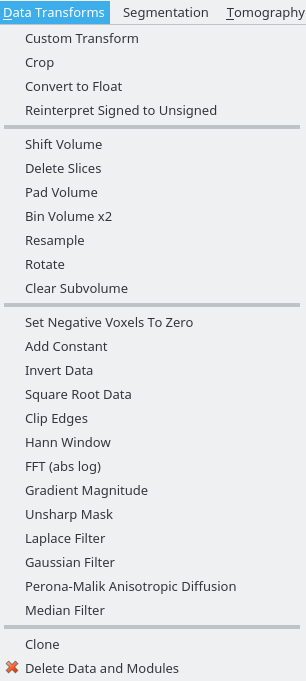
You can view the source code of the Python operators, and double-click them to edit inputs or view the source code. All operators run in a background thread, and the application remains interactive while they execute. The screenshot above shows the contents of the menu.
They are roughly grouped into data manipulation (crop, conversion to float, reinterpreting types), volume manipulation (shift, slice deletion, padding, binning, clearing subvolumes), and more general operations (invert data, FFT, Gaussian filter). They can be combined in pipelines, and the code used as a starting point in developing custom data transforms.
Quality Metrics
Tomviz includes operators for computing quality metrics on your data. These operators produce tabular results that are displayed as interactive line charts using the Plot module.
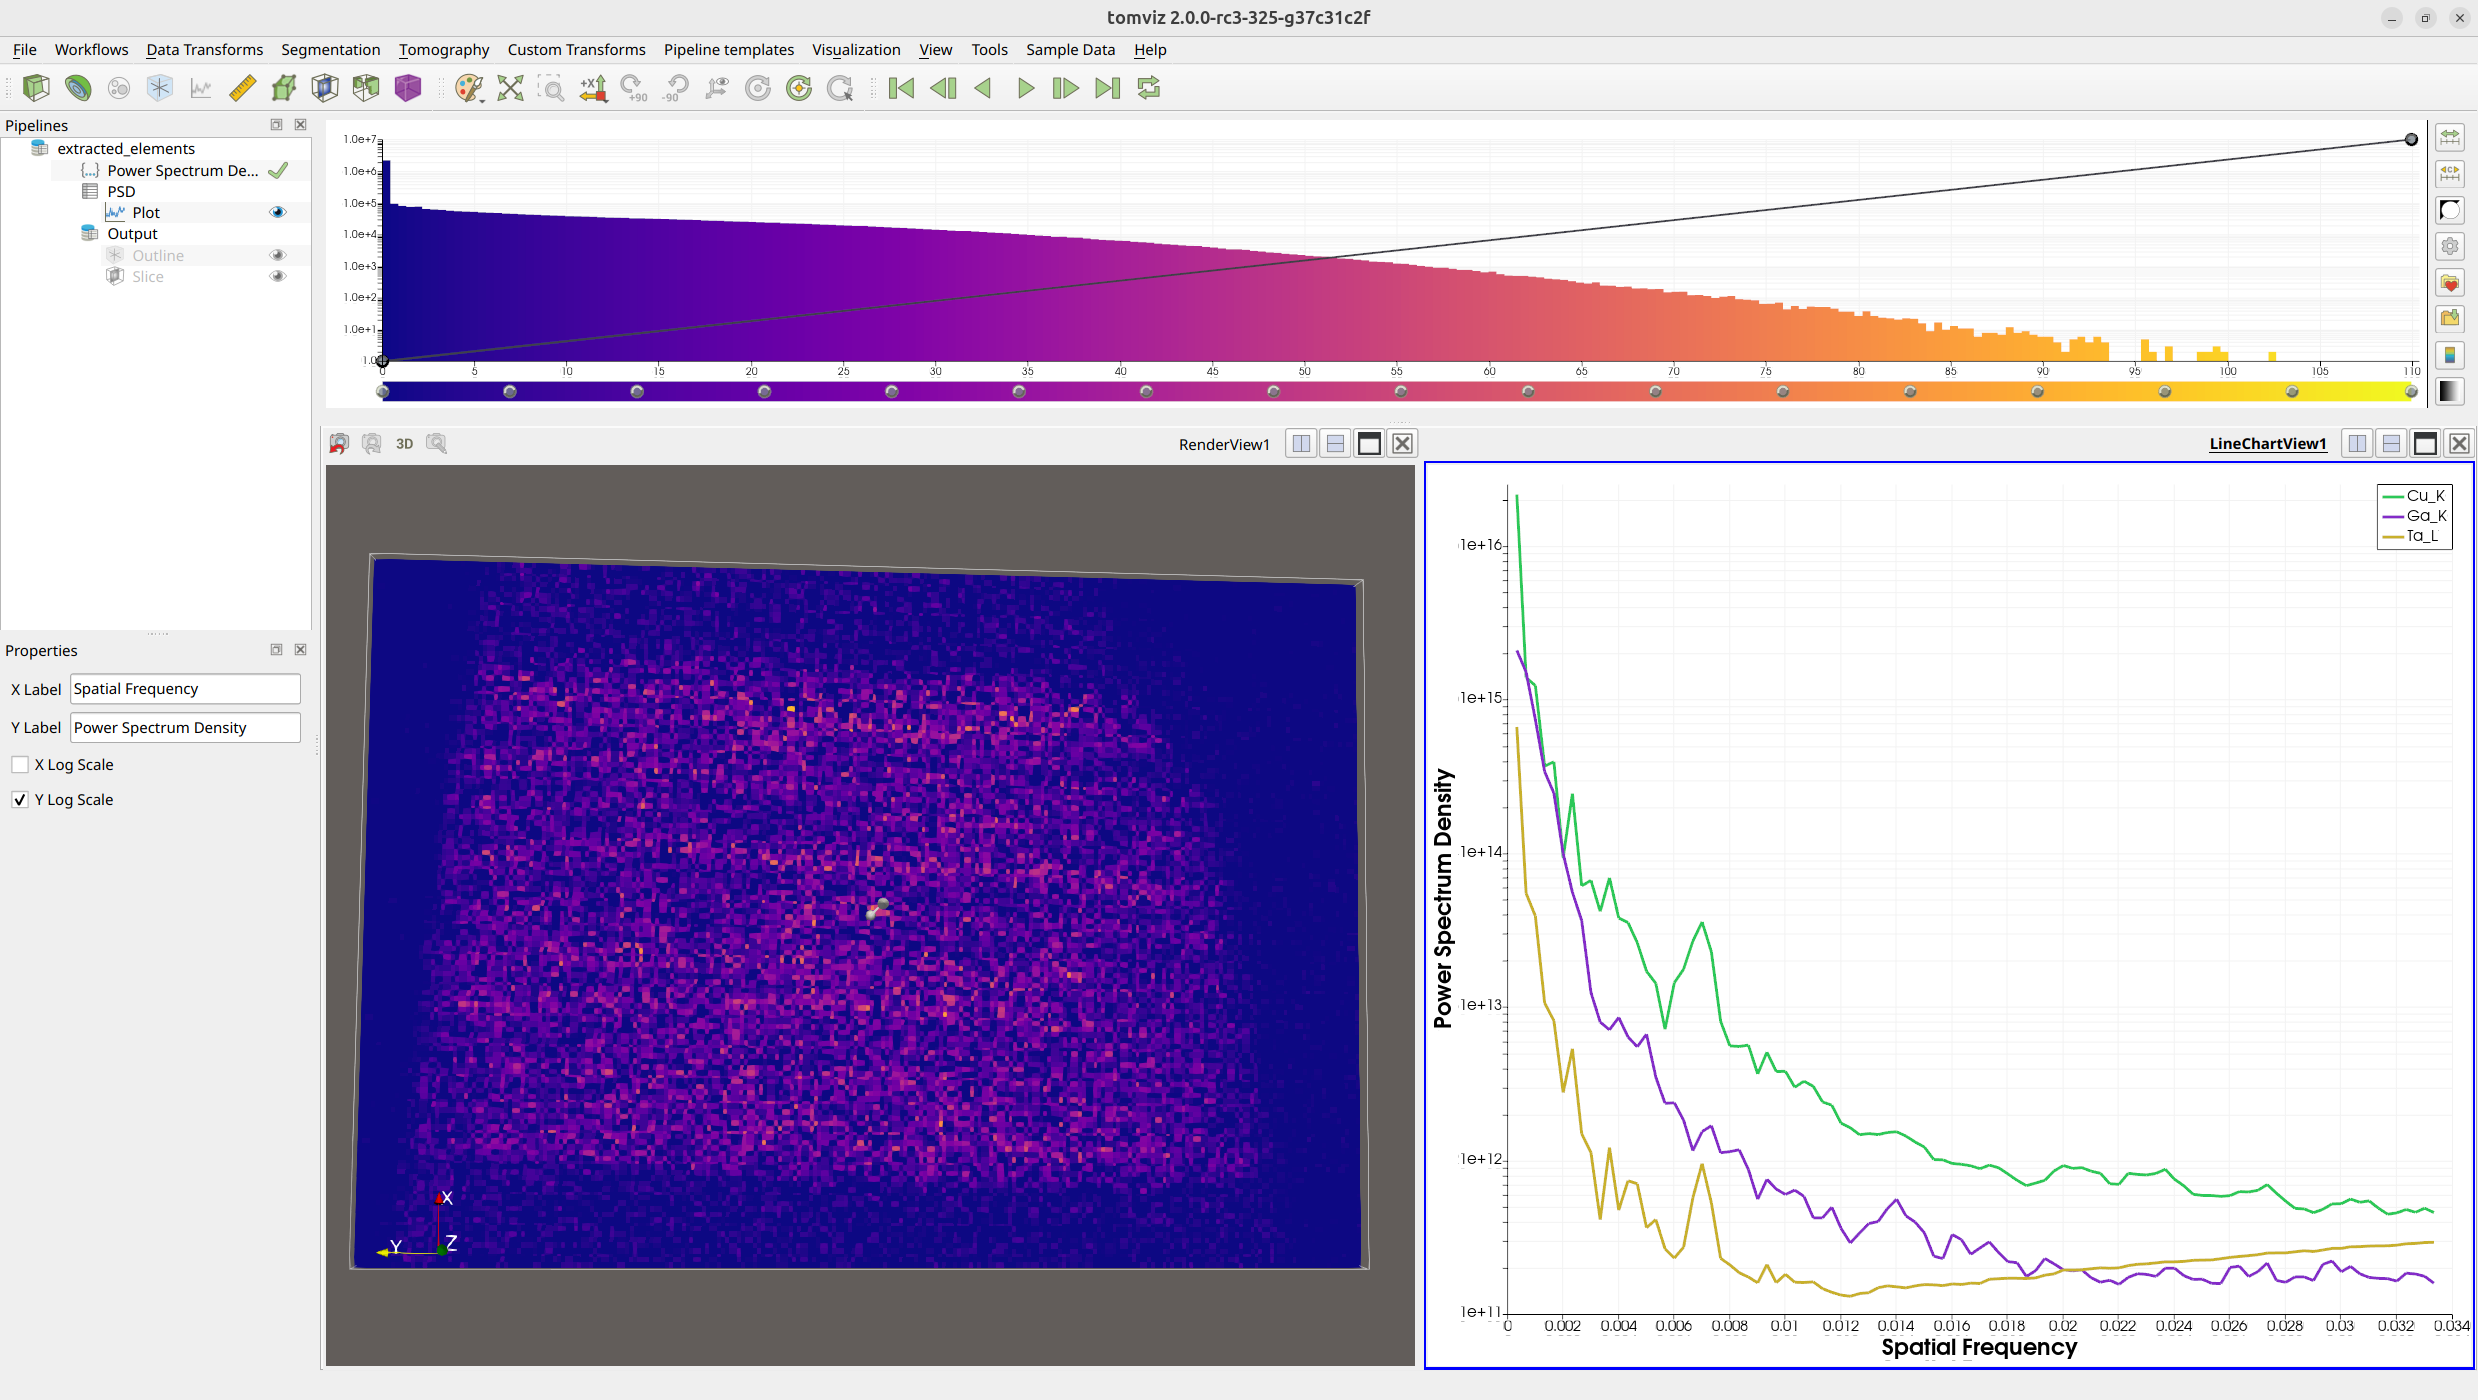
Power Spectrum Density (PSD)
The Power Spectrum Density operator computes the 1D power spectrum of volumetric data, which is useful for assessing data quality, identifying periodic features, and evaluating noise characteristics. The results are displayed as a line chart in the Plot module.
The PSD operator automatically pads the data to cubic dimensions to prevent errors from non-cubic inputs.
To run the PSD operator, navigate to Data Transforms and select
Power Spectrum Density.
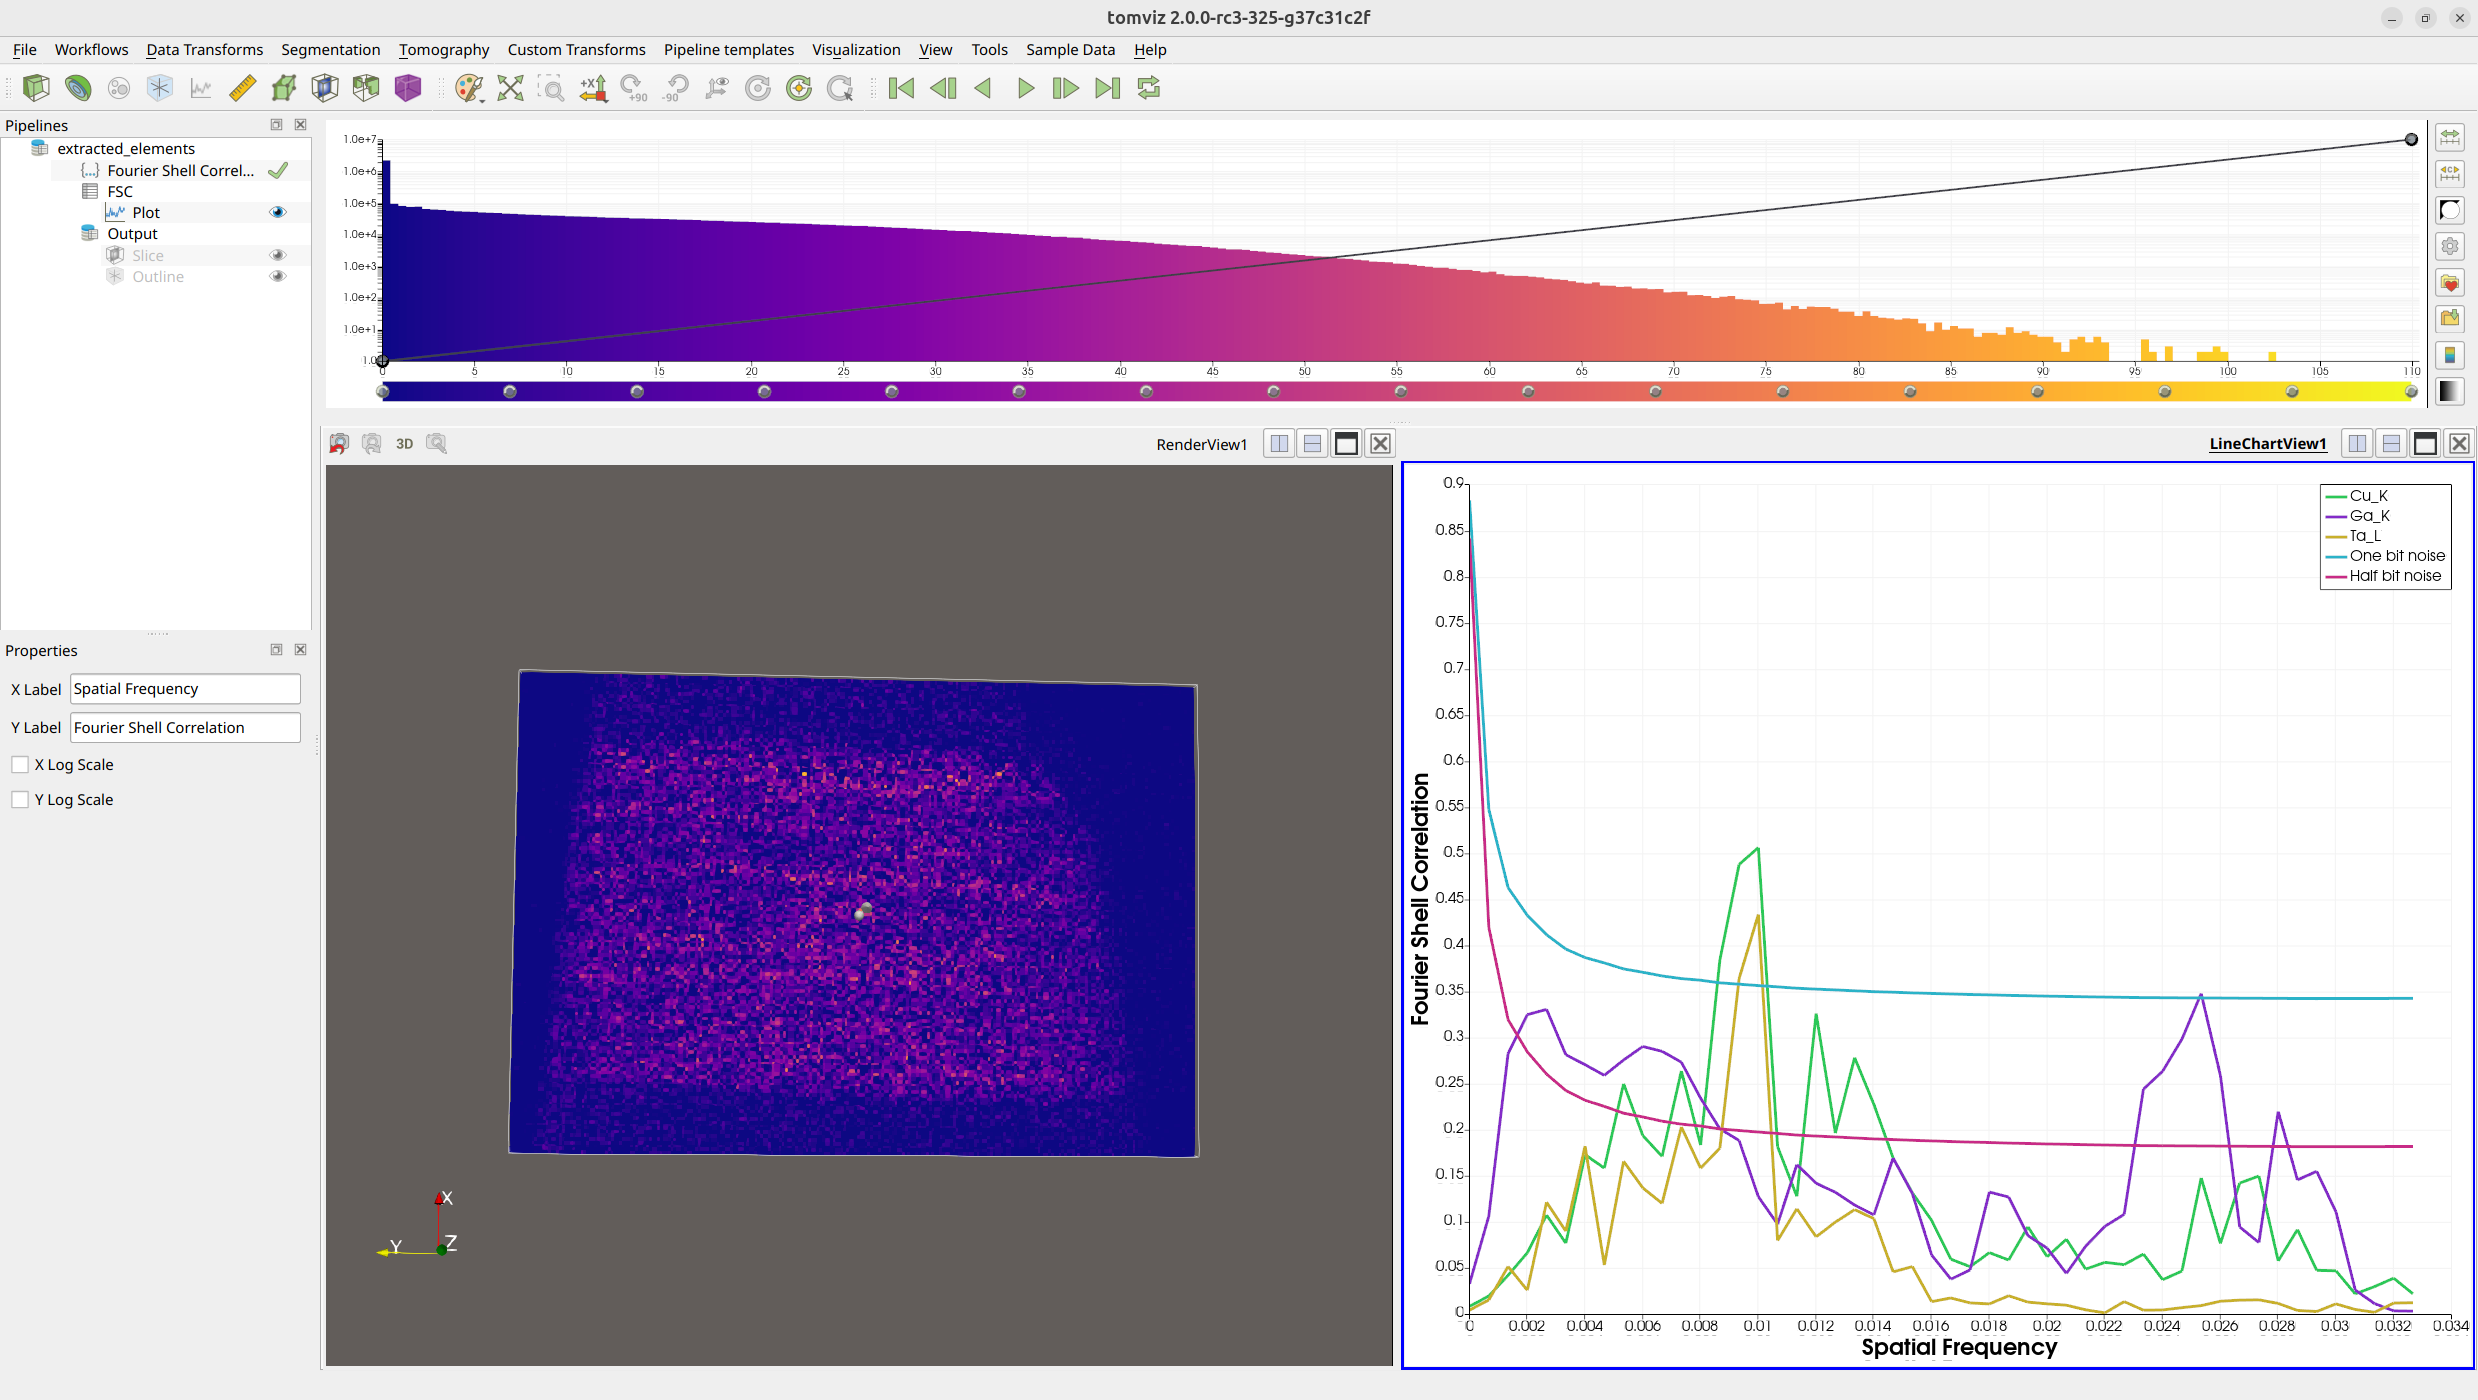
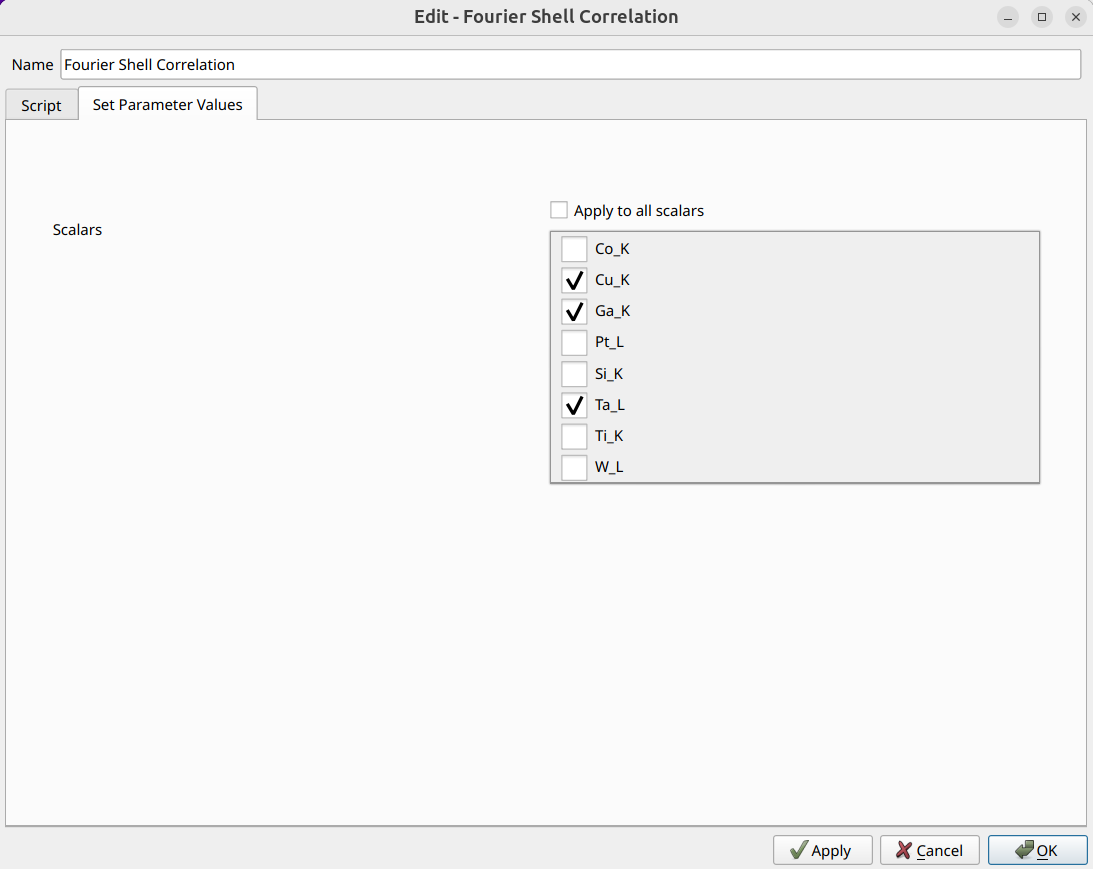
Fourier Shell Correlation (FSC)
The Fourier Shell Correlation operator computes the FSC between two scalar arrays in the dataset, providing a measure of similarity as a function of spatial frequency. This is commonly used to assess the resolution of tomographic reconstructions.
The FSC operator allows you to select which scalar arrays to use for the correlation via a scalars subset selection interface. This is particularly useful when a dataset contains multiple arrays and you want to compare specific pairs.
To run the FSC operator, navigate to Data Transforms and select
Fourier Shell Correlation.
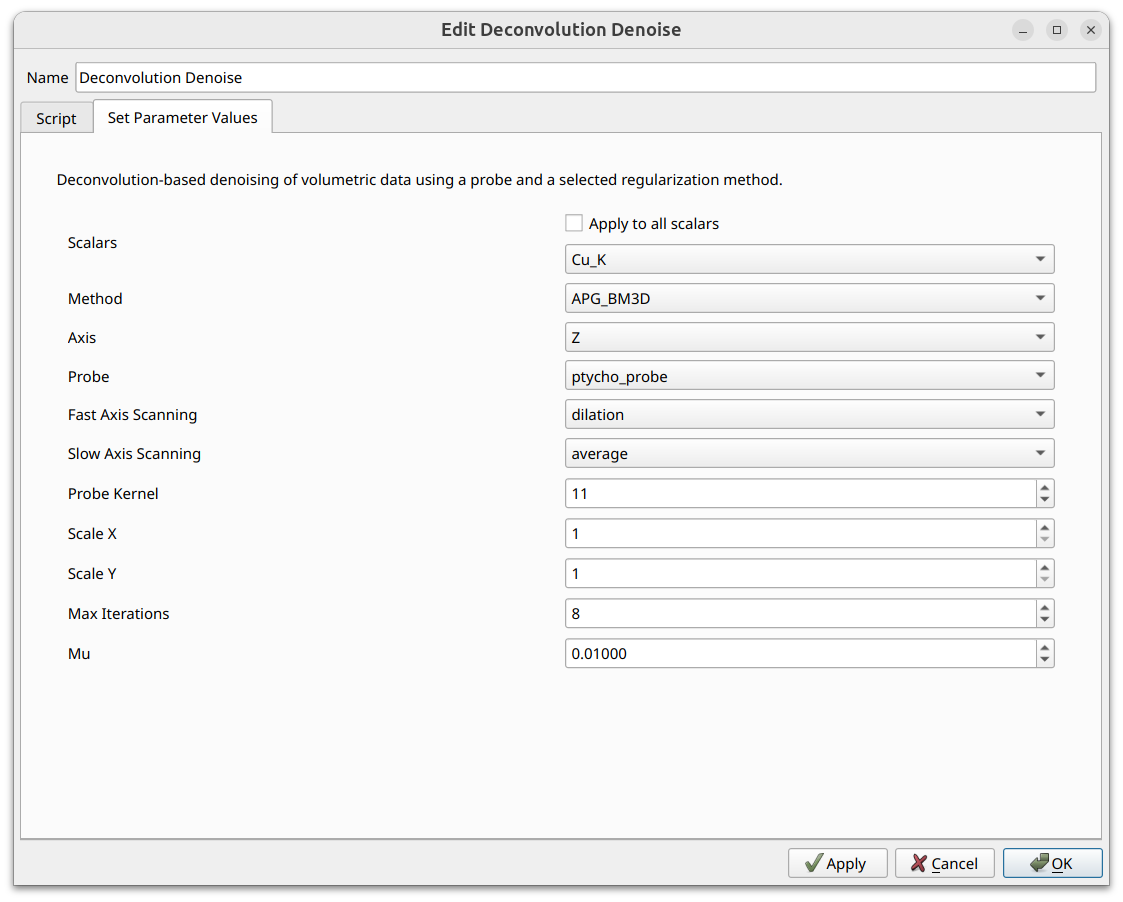
Deconvolution Denoise
The Deconvolution Denoise operator performs deconvolution-based denoising of volumetric data using a ptychographic probe and a selected regularization method. The operator uses the probe’s amplitude as a point spread function (PSF) and applies deconvolution slice-by-slice along a chosen axis, making it especially useful for denoising ptychographic reconstruction data.
Three methods are available: APG_BM3D (the most accurate but slowest, and
requires the bm3d package to be manually installed), APG_TV, and ADMM_TV.
See the operators catalog for
full details on all parameters and methods.
To run the Deconvolution Denoise operator, navigate to Data Transforms and
select Deconvolution Denoise.
Similarity Metrics
The Similarity Metrics operator computes per-slice MSE (Mean Squared Error) and SSIM (Structural Similarity Index) between the current dataset and a reference dataset. This is useful for quantitatively evaluating the effect of processing steps such as denoising. The results are output as a spreadsheet table which can be visualized as line charts using the Plot module.
To run the Similarity Metrics operator, navigate to Data Transforms and
select Similarity Metrics.
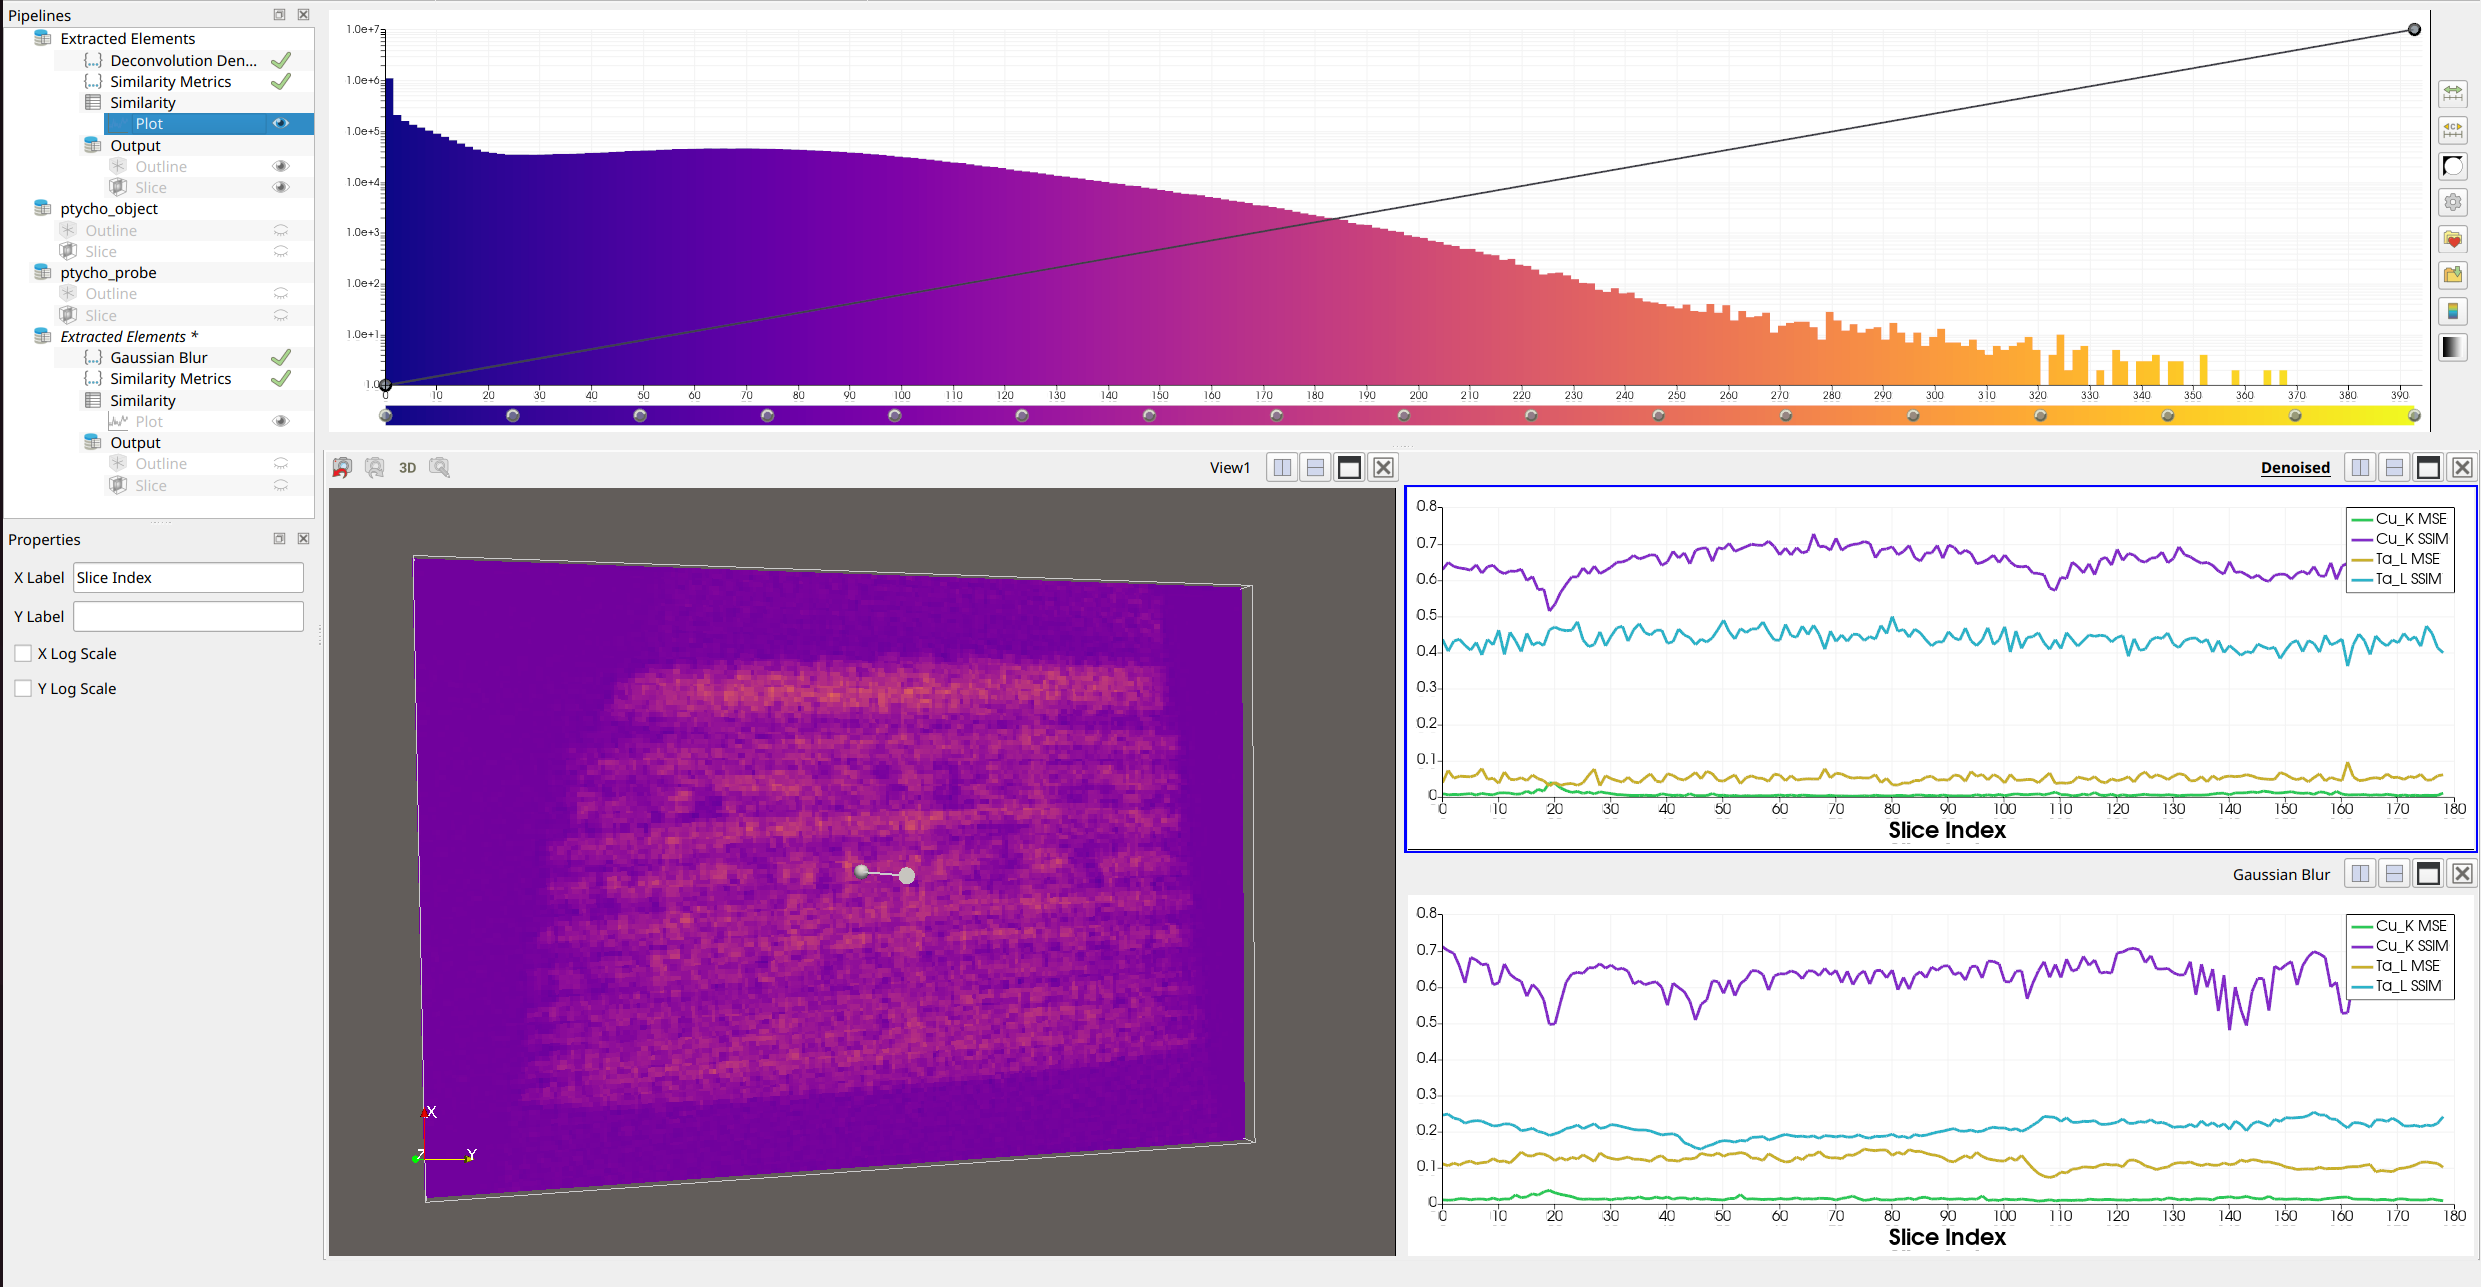
In the example above, the top-right plot shows the similarity metrics for a denoised dataset compared to the original, where SSIM values are closer to 1, indicating that the denoising preserved structural similarity. The bottom-right plot shows a Gaussian-blurred dataset compared to the original, where SSIM values are lower, confirming that blurring degrades structural similarity more than the deconvolution denoising.
See the operators catalog for full parameter details.
Scalars Subset Selection
Several operators now include a scalars subset selection interface in their operator dialog. This allows you to select which scalar arrays in the dataset the operator should process. The selection is presented as a list of checkboxes, one for each scalar array in the dataset.
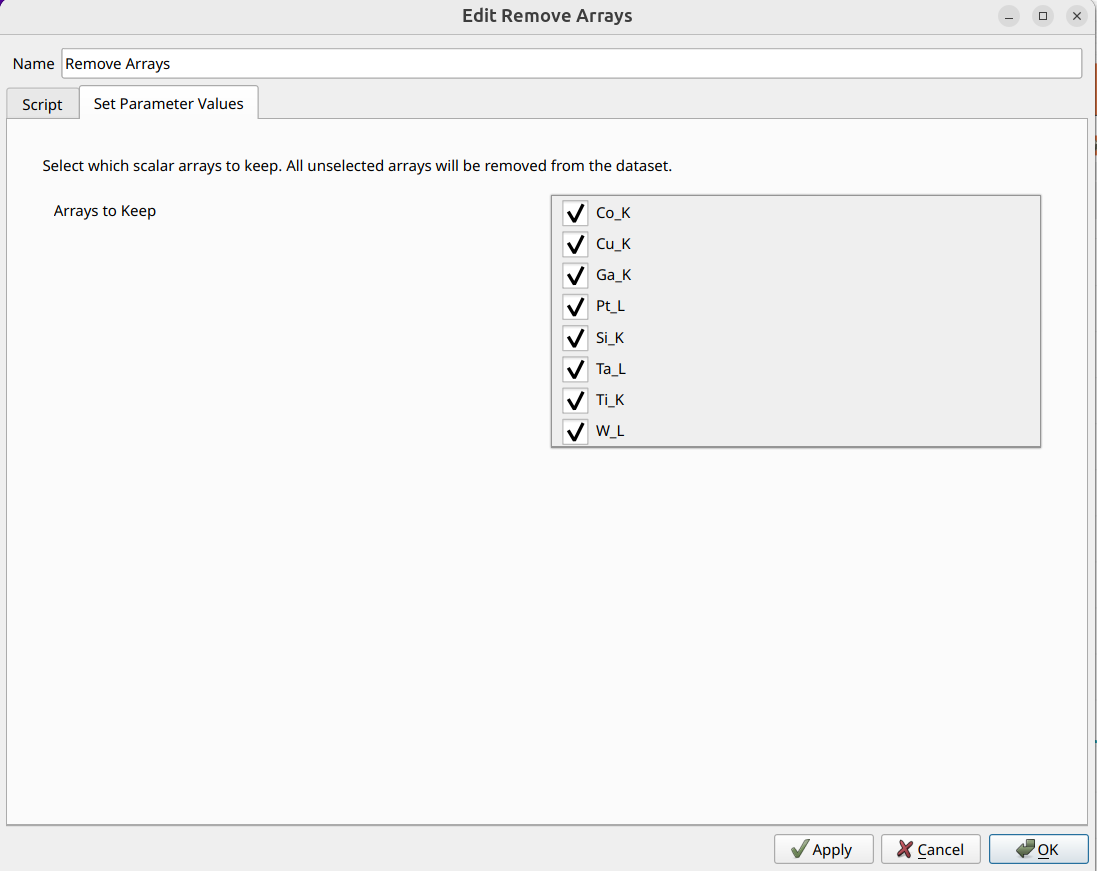
Remove Scalar Arrays
The Remove Arrays operator allows you to remove unwanted scalar arrays from a data source. This is useful for pruning datasets down to only the arrays you need, which can reduce memory usage and simplify subsequent analysis.
The operator uses the scalars subset selection interface to let you choose which arrays to keep. Any arrays that are not selected will be removed from the dataset.
To use this operator, navigate to Data Transforms and select
Remove Arrays.
Exporting Table Results as CSV
Operators that produce table-based results (such as PSD and FSC) allow you
to export the results as CSV files for use in external analysis tools. To
export, right-click the operator result table in the pipeline view and select
Export Table as CSV. You will be prompted to choose a save location and
filename.
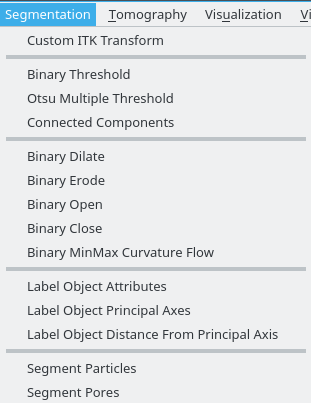
Segmentation
Tomviz offers a number of simple segmentation routines that make use of ITK
under the Segmentation menu. These include operations such as binary threshold
where all voxels between the specified values will be labeled 1, geometric
operations such as binary dilate, erode, open and close. There are some labeling
operators, and some experimental particle/pore segmentation.